Remote Sensing and Settlement Fires
- s1544997

- Nov 12, 2018
- 3 min read
Updated: Nov 23, 2018
EEO Seminar: Informal Settlement Fires: a case study from South Africa & RS settlements
Seminar by Dr David Rush & Dr Lesley Gibson

So what was the talk about and why is it an important topic?
In summary, fires can wreak havoc on informal settlements (IS) due to their building materials, layout and density. Human lives are affected and severely impacted because of these fires and the talk aimed to find measurable ways to detect these fires for studies to help limit them in time. The talk focused on South Africa for their research and discussed the results at the seminar.
Across the globe over 1 million people live in IS with that number rising every year. Informal settlements are high density housing areas with narrow access ways built quickly by residents with whatever material they can get. An example of an IS would be of the favelas in Rio de Janeiro.
The problem with these settlements is that they are built from flammable materials like plastic sheeting, carpets, cardboard and steel roofing, all of which aid the rapid spread of fires through these settlements. IS are also dense settlements and are very congested which can help the fire spread from house to house and trap residents.

What techniques were used and why were they suitable?
The project: IRIS – Fire (Improving the resilience of informal settlements to fire)
Find out more here: https://www.iris-fire.com/
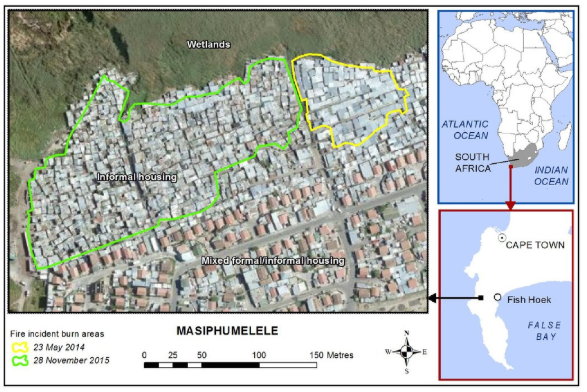
It’s a 3-year project that is being run in South Africa that is using remote sensing data to create maps of high risk informal settlements as well as working with other disciplines (socio-political etc). The talk focused on the remote sensing results. IRIS used satellite data from sentinel 2 and google earth search engine. The optimal resolution of 9 metres for the images they looked at. The data they used from sentinel 2 was not atmospherically corrected so IRIS created an algorithm to correct the data and remove any cloud cover etc from the areas they were looking at.
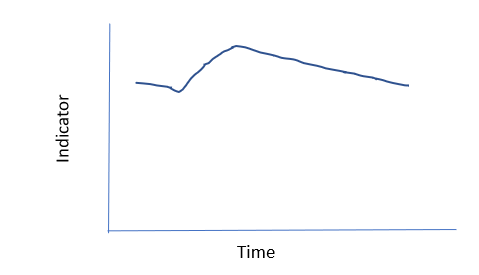
The remote sensing part of the project focused on detecting areas in south Africa where fires had occurred and so they wanted to create a time series/ change and detect approach. Before starting, the team hypothesised that the response over time to an indicator (reflectance) would look something like this for a wildfire and an informal settlement:

For a wildfire there will be a long recovery over time whereas, it is hypothesised, that for an informal settlement fire there will be a short and rapid recovery that exceeds the indicator for before the fire. Over time the indicator level will fall to that of just before the last fire (see above image). IRIS was looking at their satellite data for sudden dips and rises that would indicate that there had been a fire. IRIS used increase in reflectance as the measured indicator. In South Africa, most informal settlements are roofed with steel. After a fire the government provides shiny new steel roofs which reflect more light than older steel roofs. Therefore, there is a clear visual difference between IS that have not been affected by fire and those that have in South Africa.


What were the principal results?
Main results showed that reflectance decreases after a fire has occurred (dull, burnt patches or rubble do not reflect much light) and that reflectance increases after a new steel roof is added. The hypothesised dip in reflectance was not seen in the curve over time ever. Instead, in IS where a fire had occurred, the curve pattern showed an increase in reflectors without a dip:

E.g. Kosovo fire, 30th November 2016. No dip seen from the data. It took just 3 days from when the fire stopped for the whole area to be rebuilt. Large increase in reflectance from new rooves.
IRIS also noticed that there was a lot of noise from their time series. The data showed a lot of false positives where it looked like there was an increase in reflectance and therefore a fire, yet when they checked against records there wasn’t a fire.
How did the talk advance our knowledge?
What did we learn from the talk? For one thing, we now know that remote sensing can detect fires using reflectance as an indicator (In South Africa). Results show peaks in reflector time series graphs which indicate fires. The talk brought over a great sense of urgency in the IRIS project as it wants to help reduce IS fires as they are a risk to populations.
However, there is a long way to go before IRIS reaches any actionable solutions. Further research would be needed to reduce the false positives from the graphs as well as more data from remote sensing and other disciplinary projects before any solid results can be applied to other IS across the globe.


Comments